Portfolio
I have gained a diverse array of experiences in GIS and drone-related modeling through my studies at Portland Community College and through my personal projects.
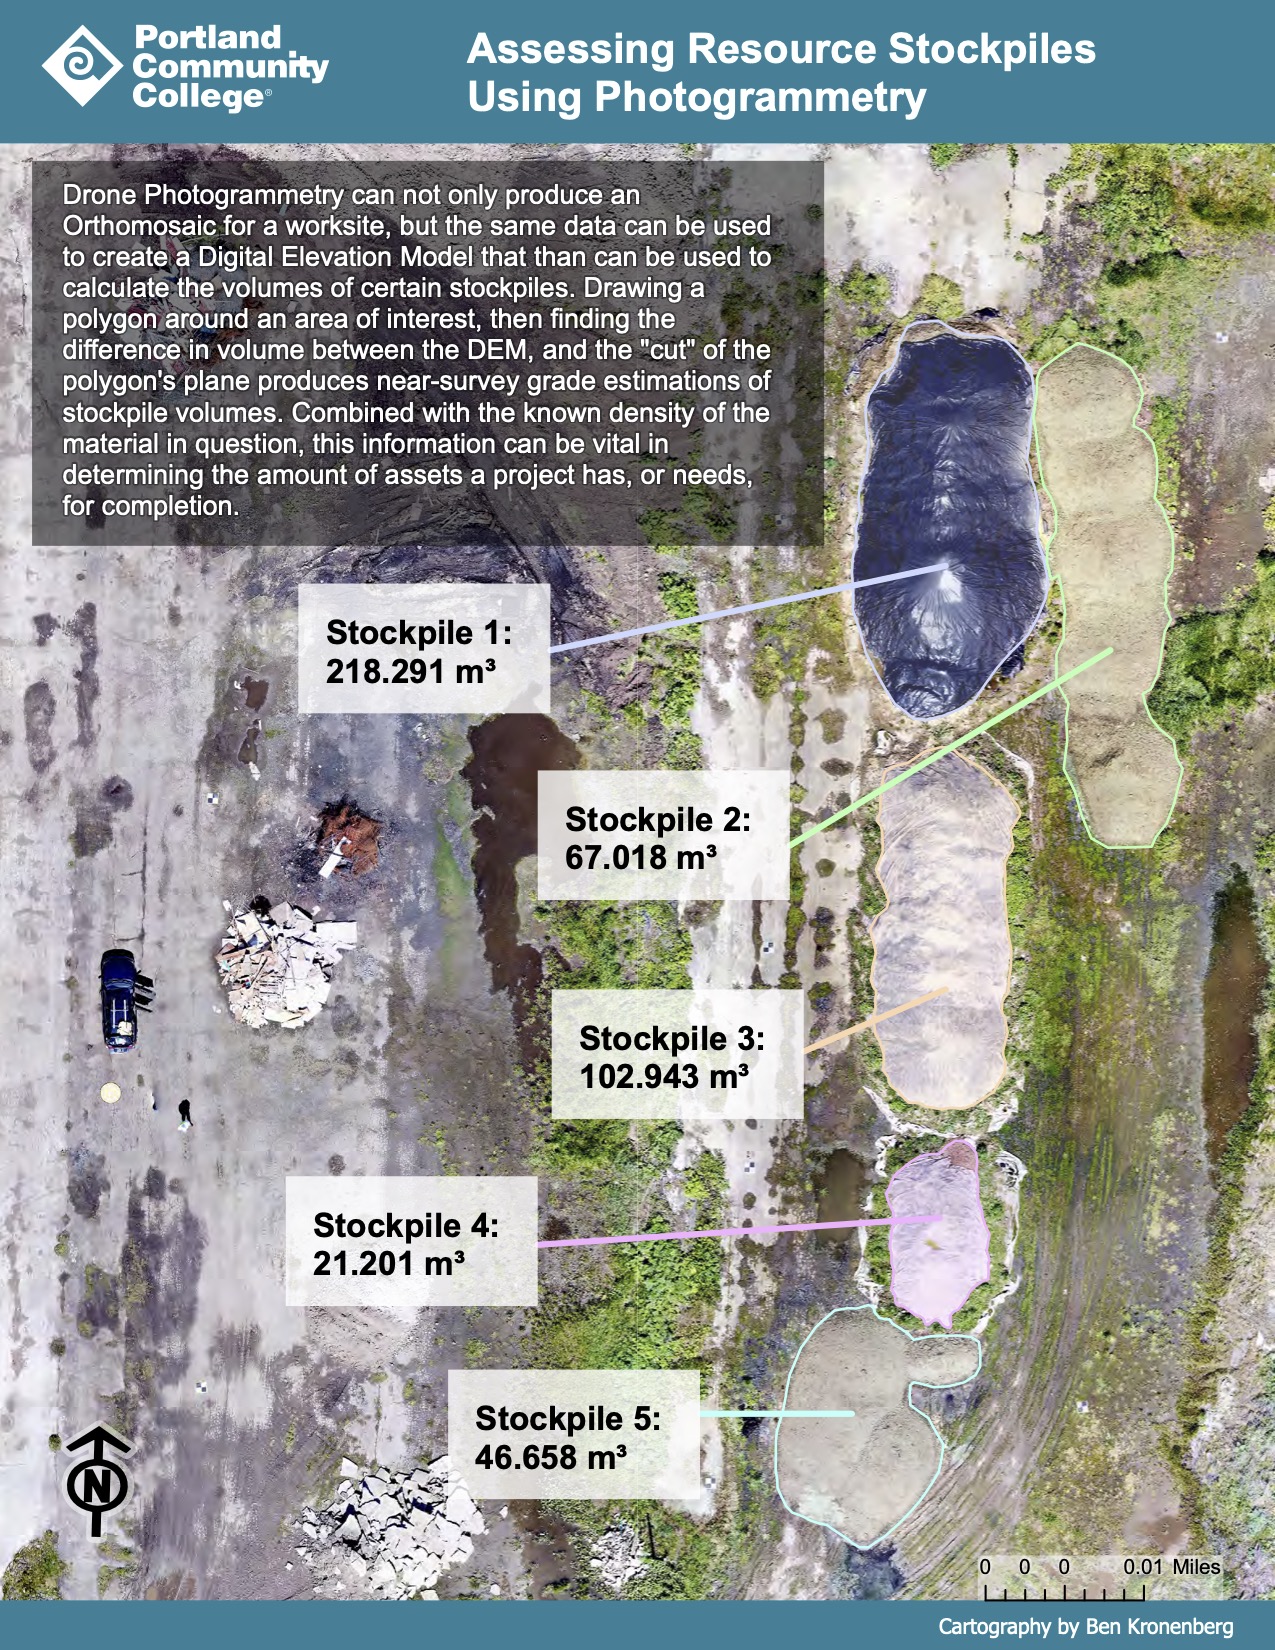
Cut Analysis for Measuring Stockpiles
Drone imagery and Ground Control Points were collected and processed into a DEM and Orthomosaic with Agisoft Metashape Professional. The DEM data was used to assess the volume of five stockpiles, which has applications in construction, surveying, project management, and cost analysis.

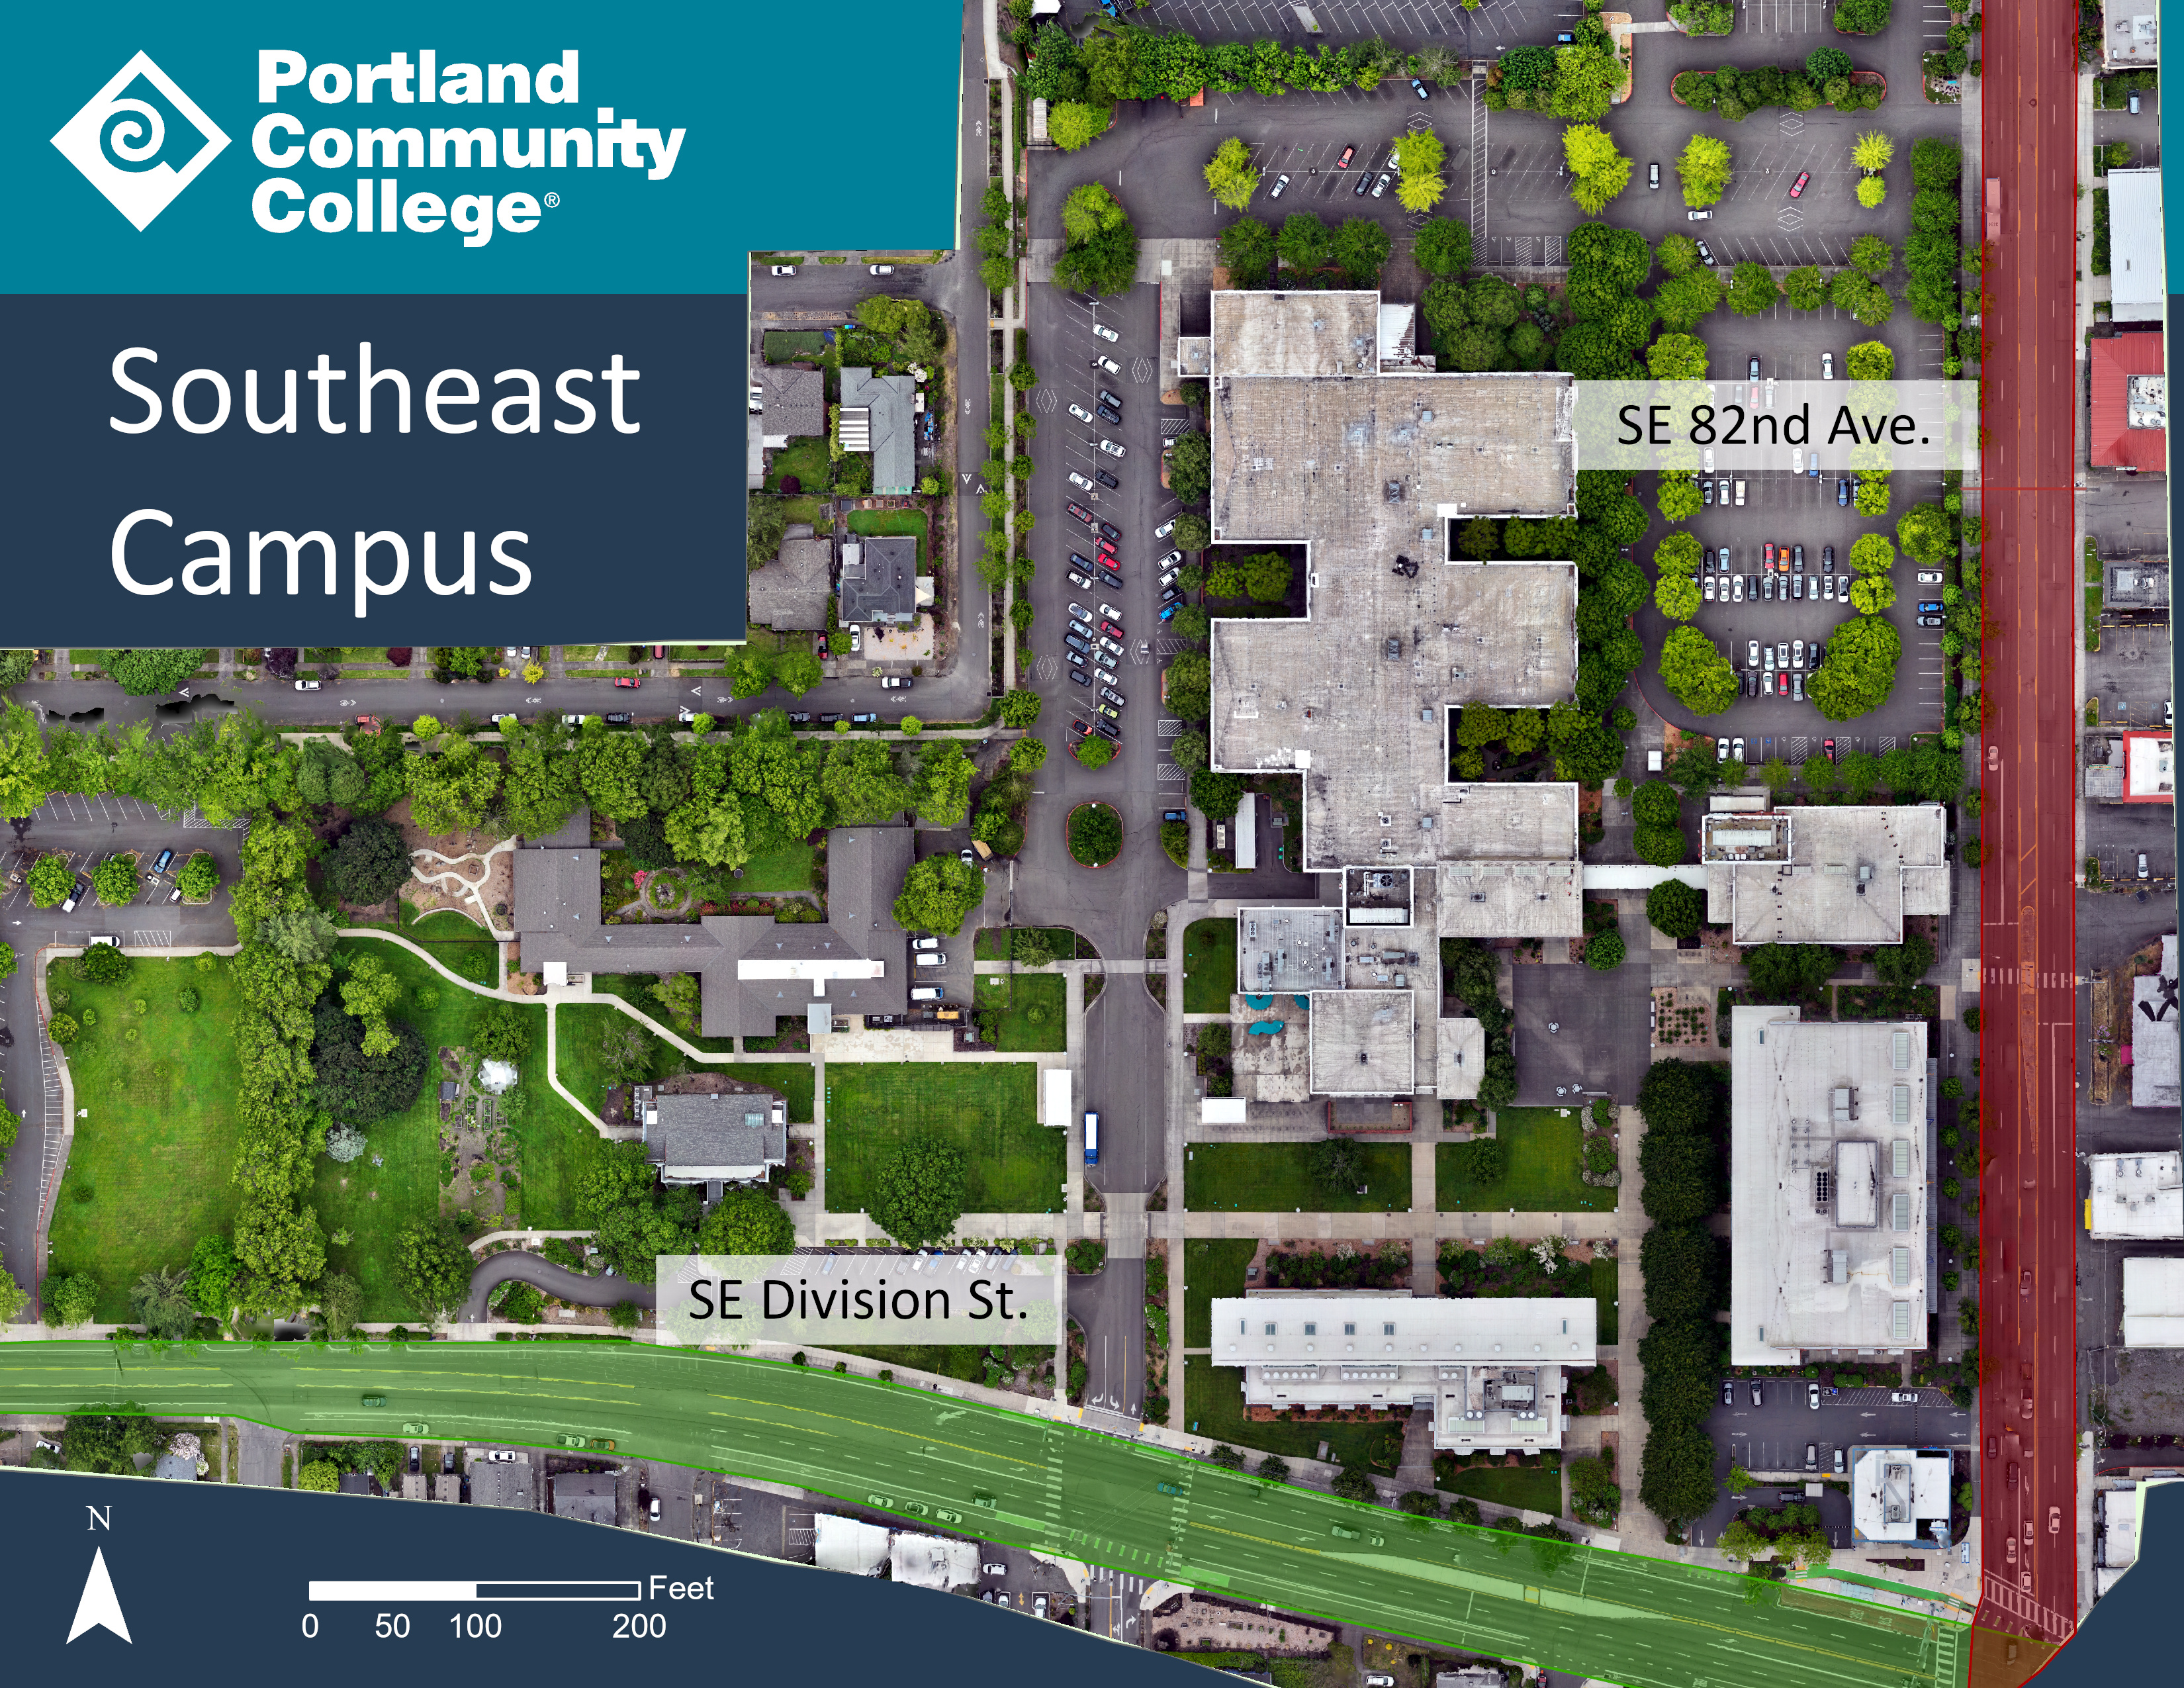
TriMet Network Analysis
This map was developed as an independent experimentation of network analysis tools in developing optimal walking distances for the proposed MAX line that would connect the Portland city center with Troutdale. Using Walking Distance parameters, an analysis on the accessibility of the proposed line with the campus was conducted.
Campsite Suitability Analysis
Using spatial parameters that visually correlated with the Impact Reduction Program’s data on houseless people’s established campsites, I developed a site suitability analysis that factored in zoning, street type, proximity to existing sites, and slope. As the urban composition and laws that affect camping change, a model like this can help predict where the most supportive resources or code enforcement would likely need to develop.
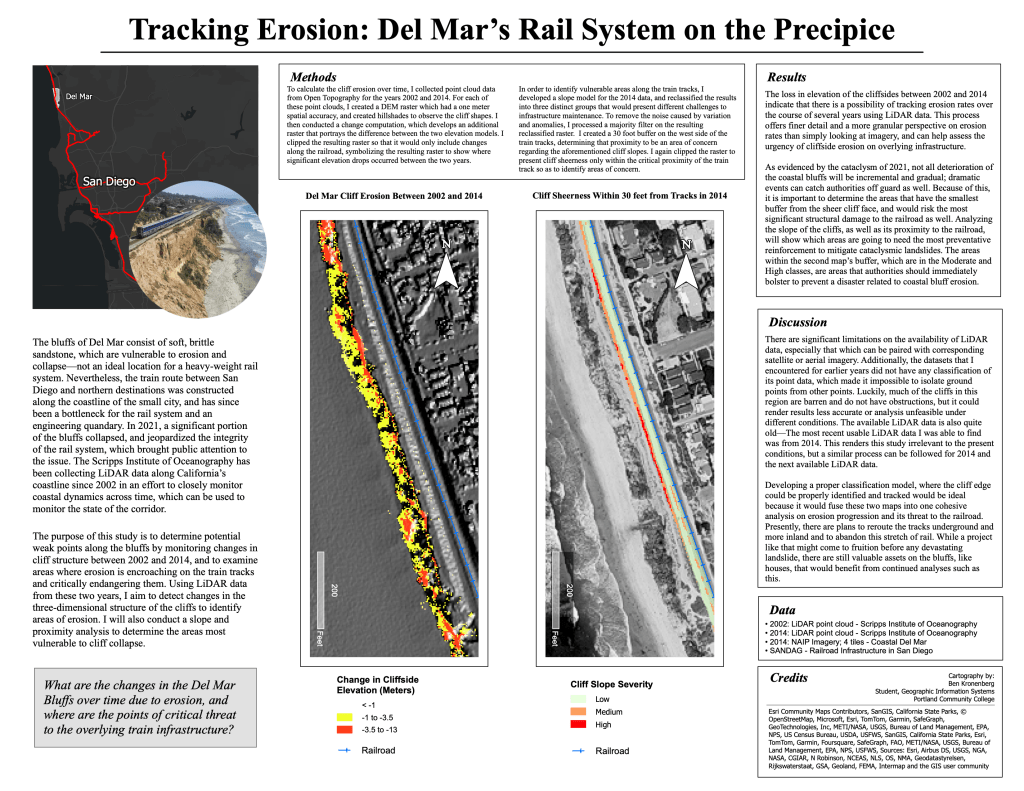
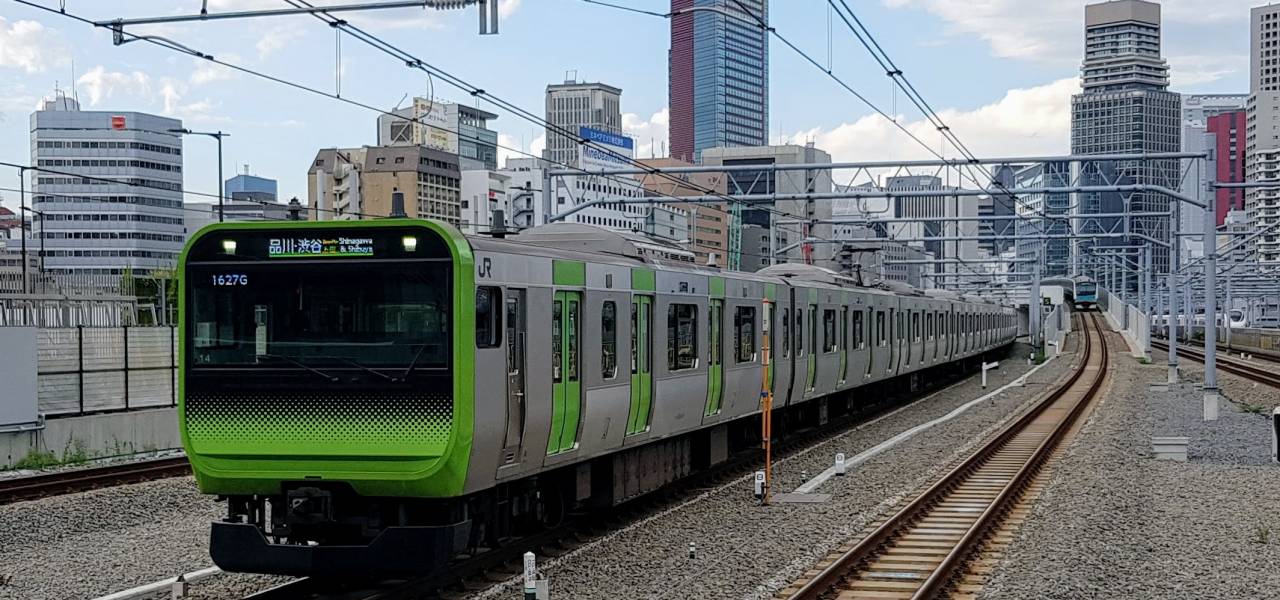
Analyzing Cliffside Erosion with LiDAR Data
Using change computation on two sets of LiDAR data, I analyzed the progress and threat of coastal erosion to a major railroad line on the coast of San Diego, CA. The stretch of tracks that I conducted the analysis on has since undergone major reinforcement projects, but only after catastrophic landslides brought attention to the matter. Remote sensing techniques can be employed to regularly monitor the condition of cliffs in order to prevent catastrophic loss.
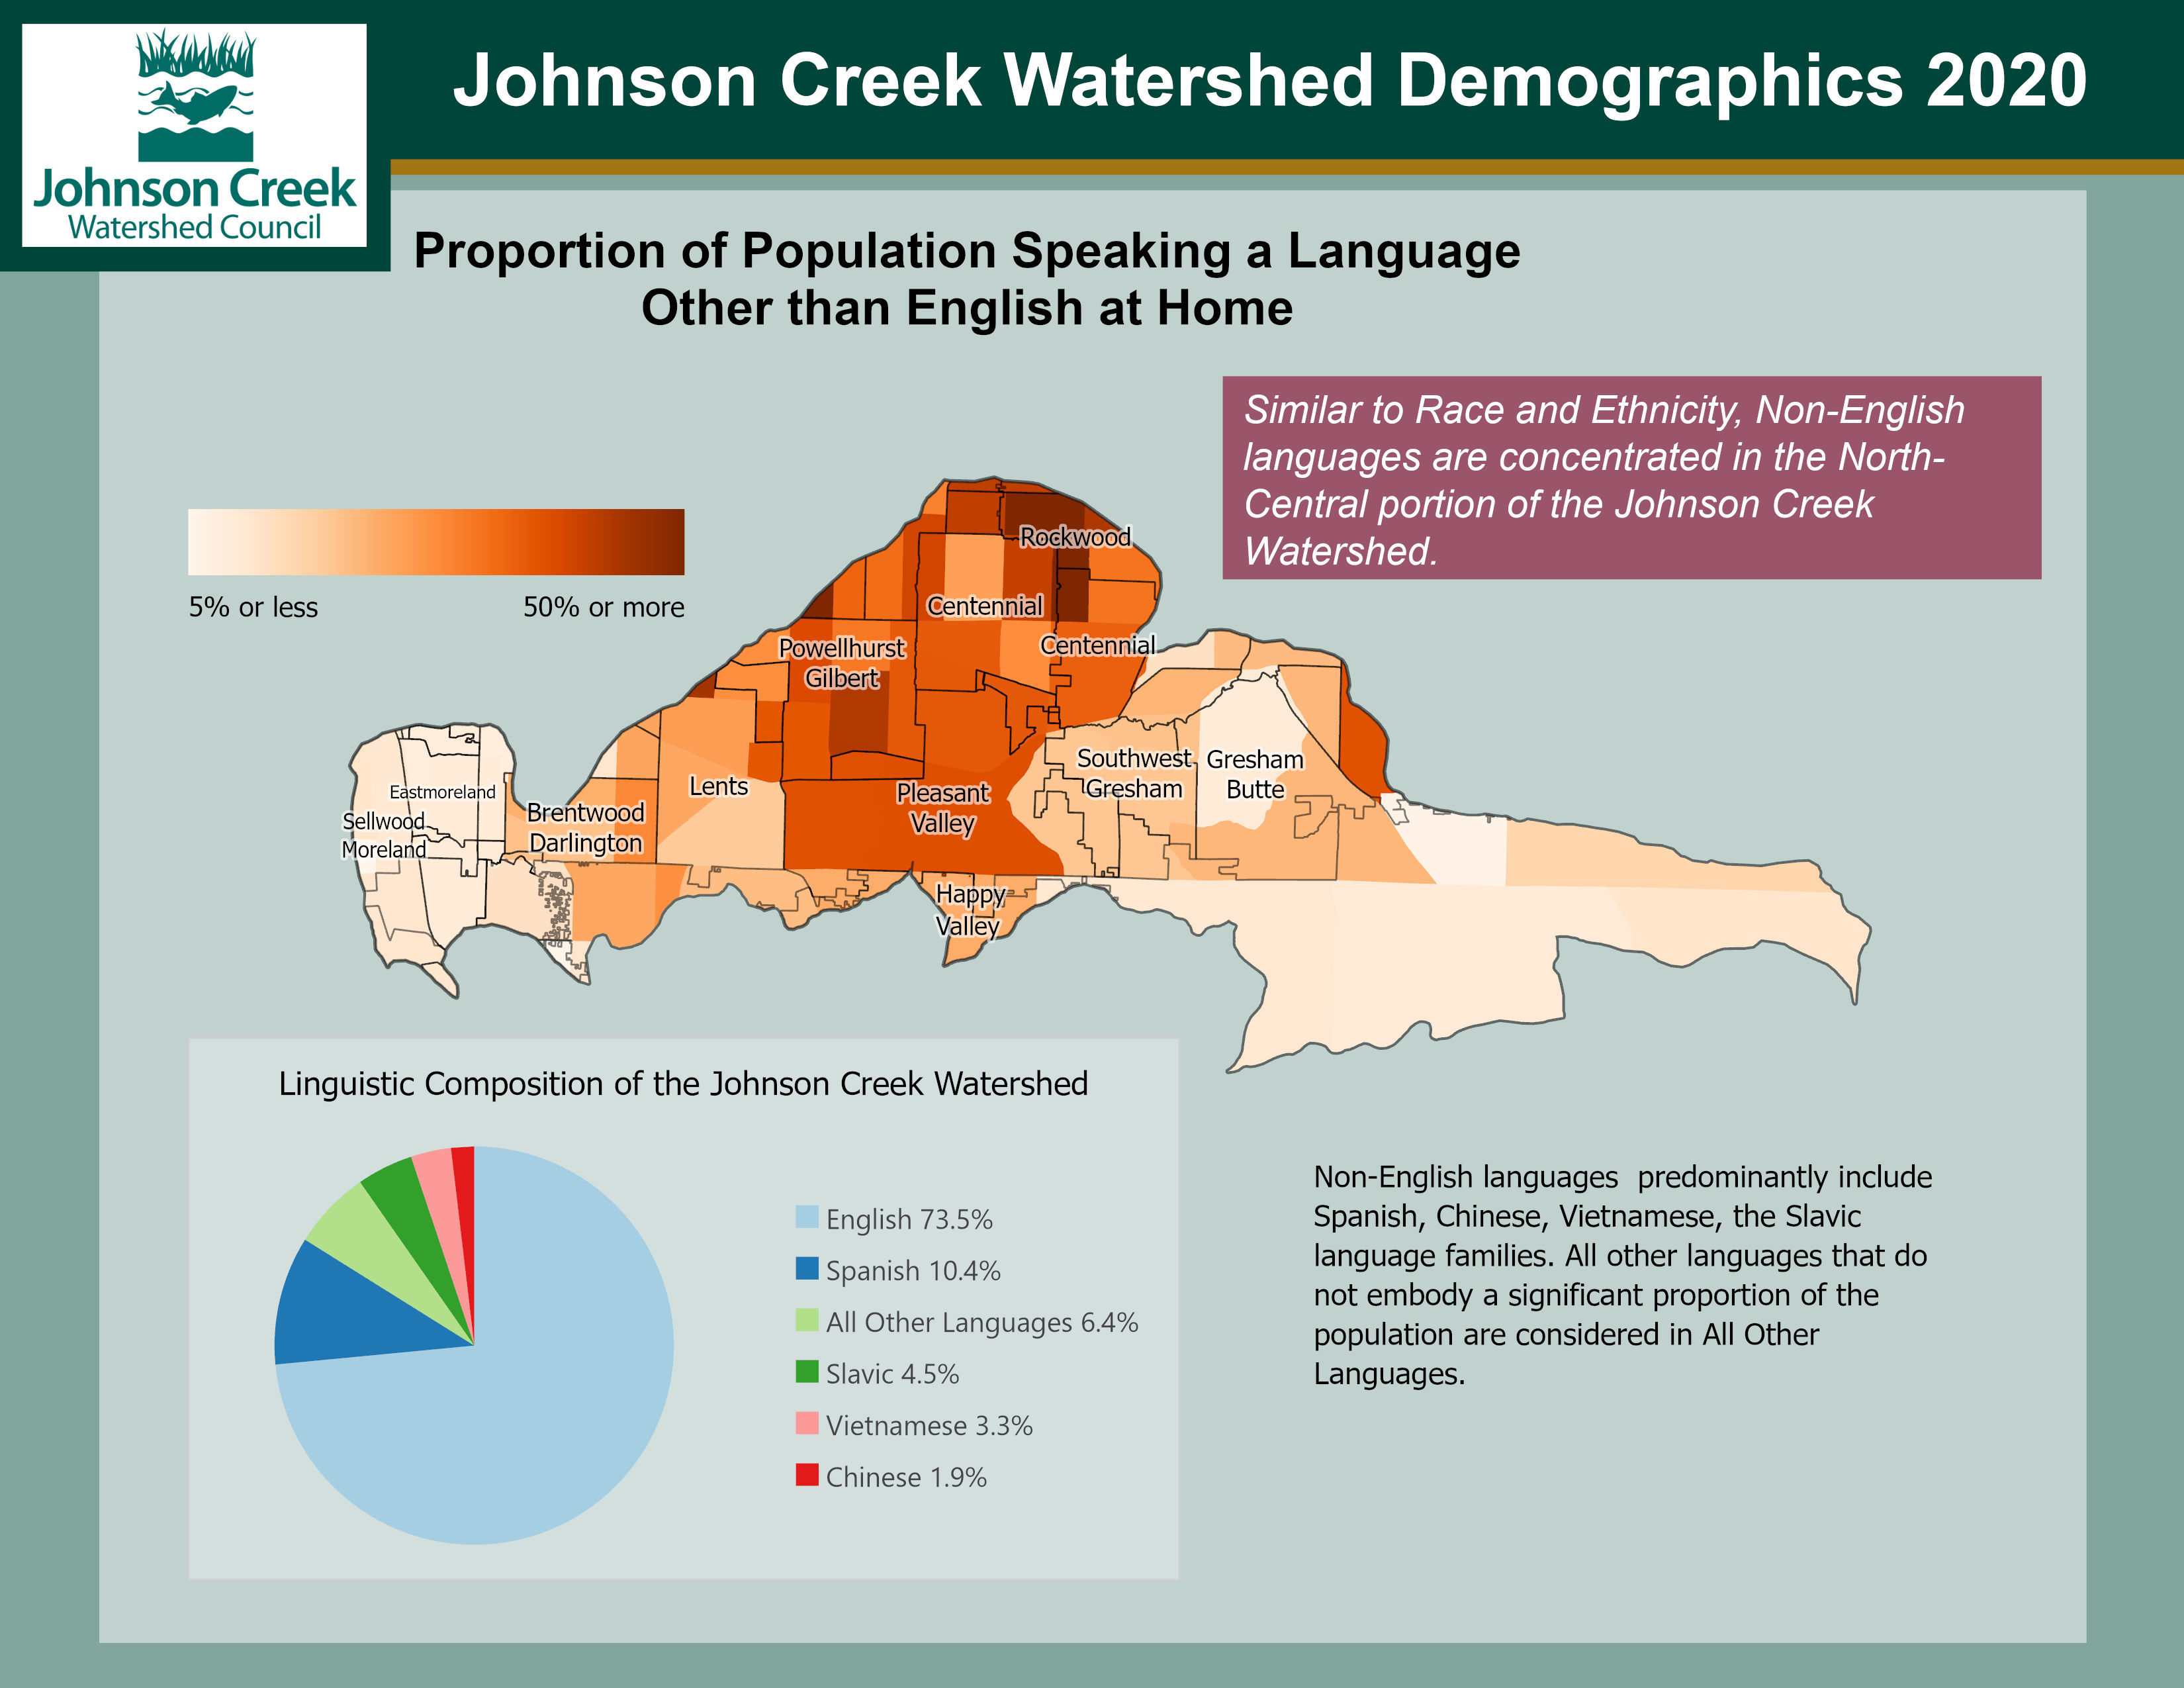
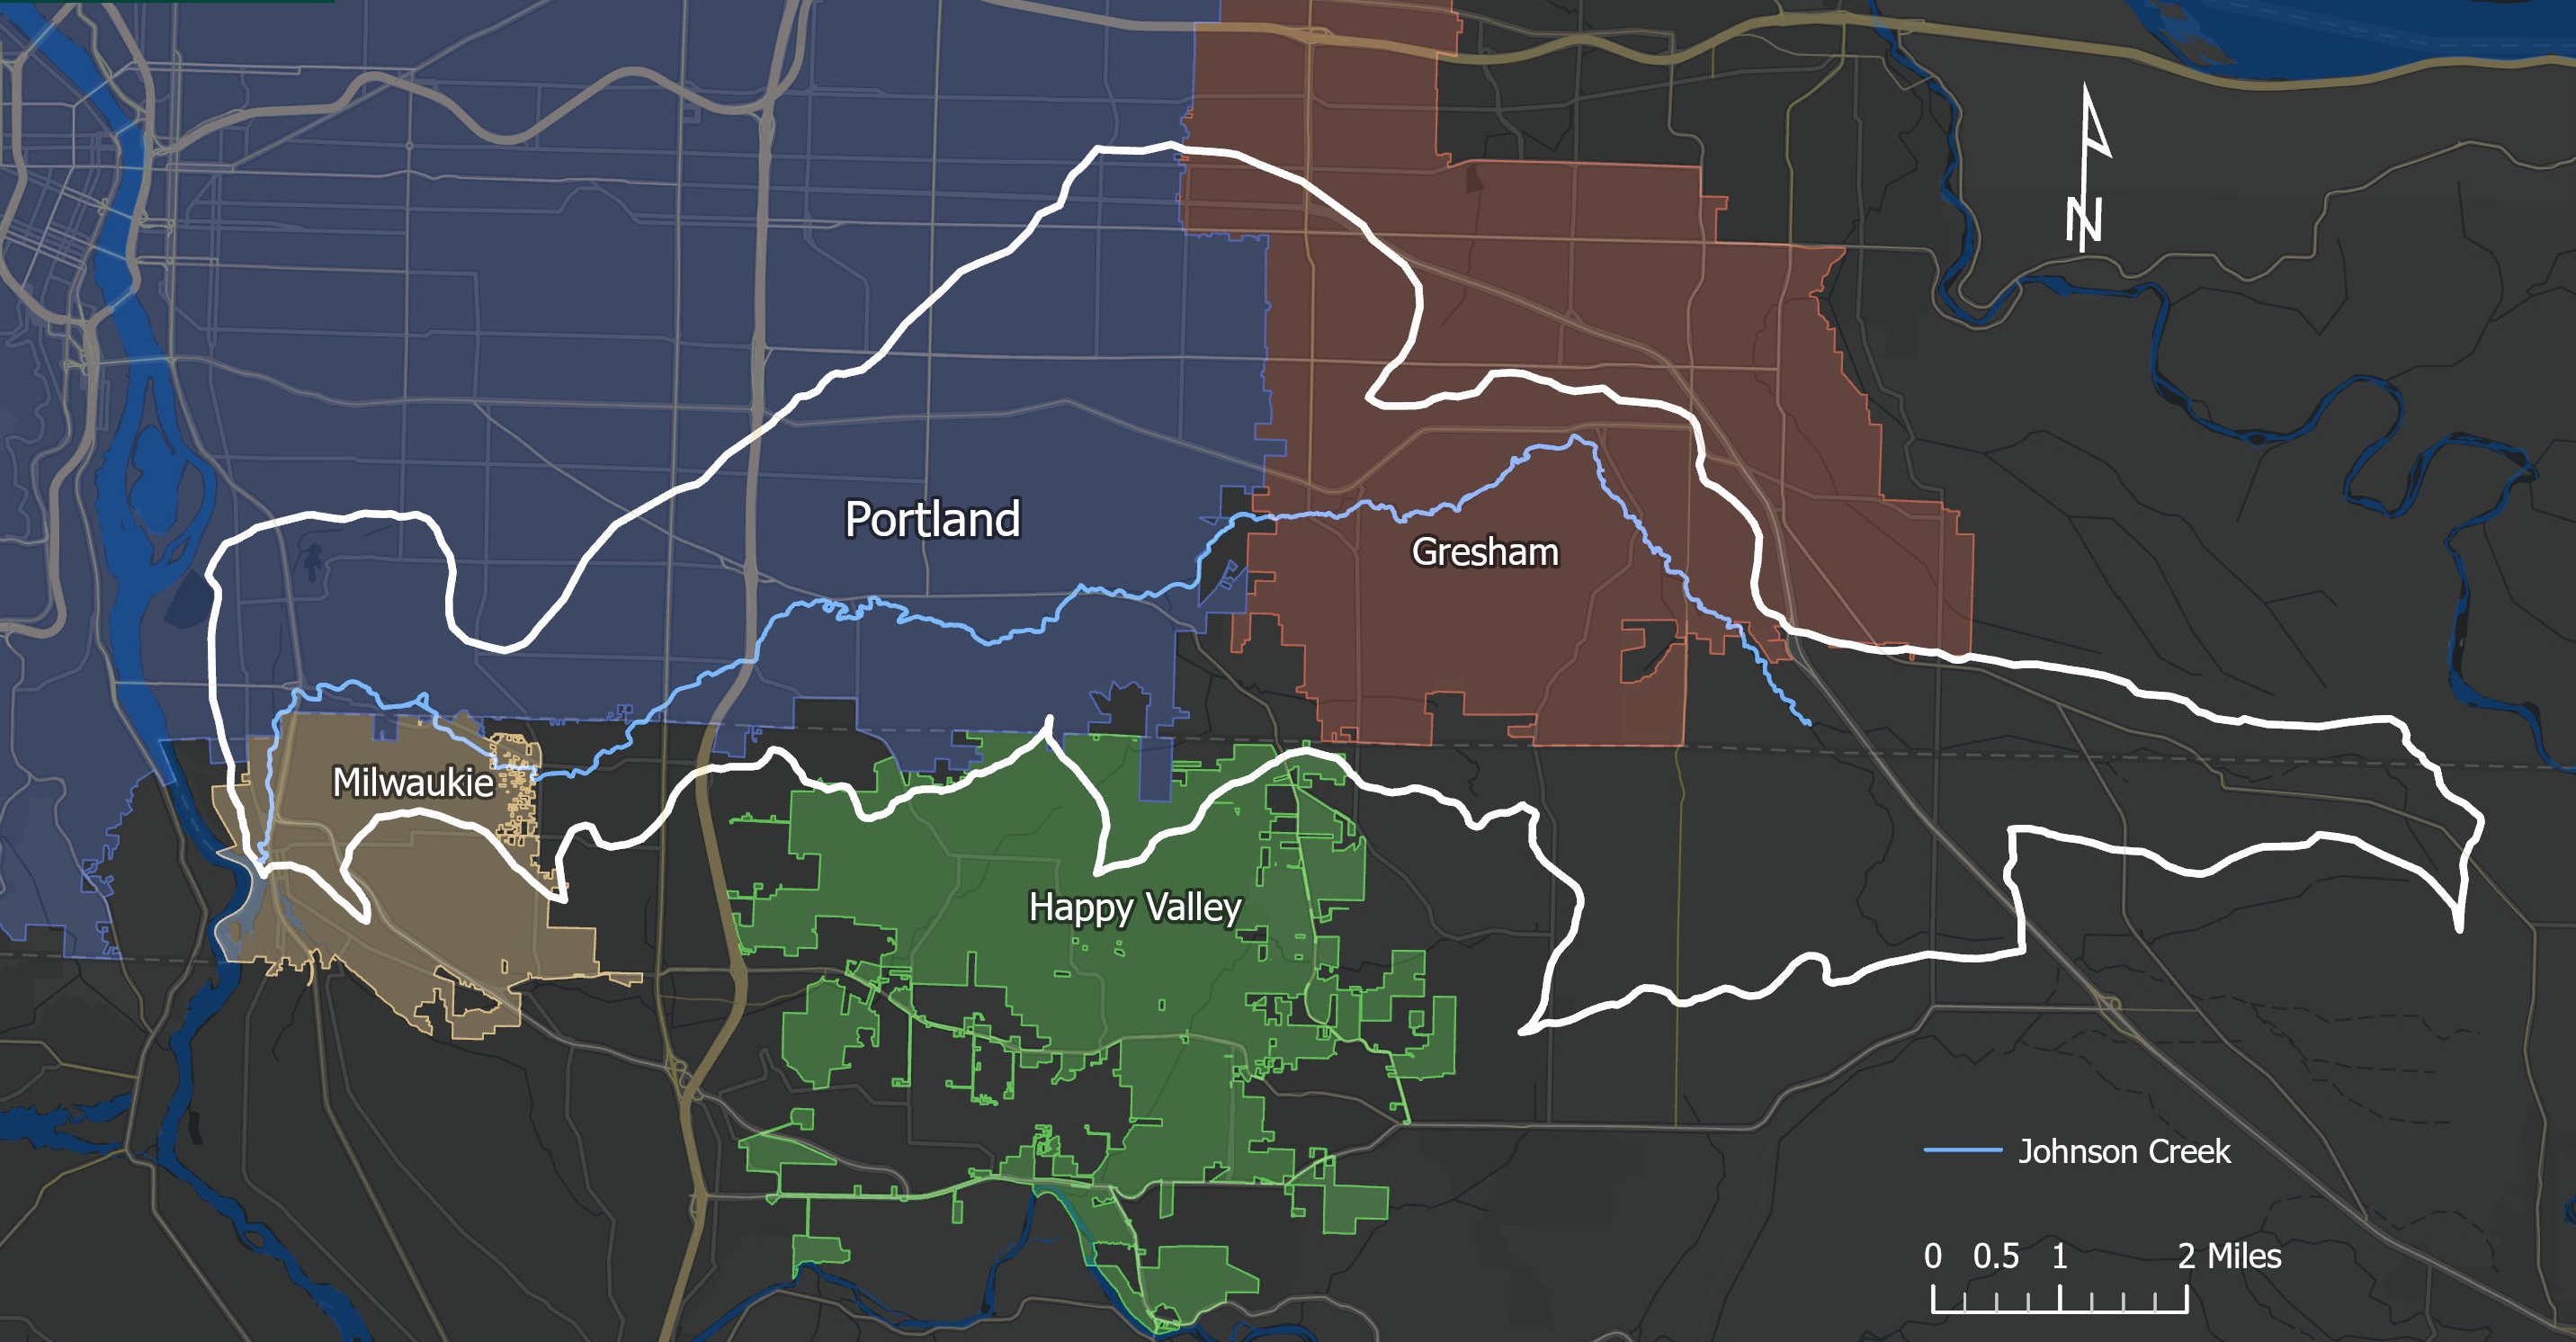
Johnson Creek Watershed Demographics
As a part of a larger study in partnership with the Johnson Creek Watershed Council, this map portrays the racial, ethnic and linguistic diversity of Johnson Creek Watershed within the jurisdiction of the city of Portland. I also developed a Storymap on this topic, which has also been published by the JCWC on their website. Other maps include a similar portrayal focusing on other jurisdictions, and the distribution of racial, ethnic, and linguistic diversity across the whole watershed by census tract.
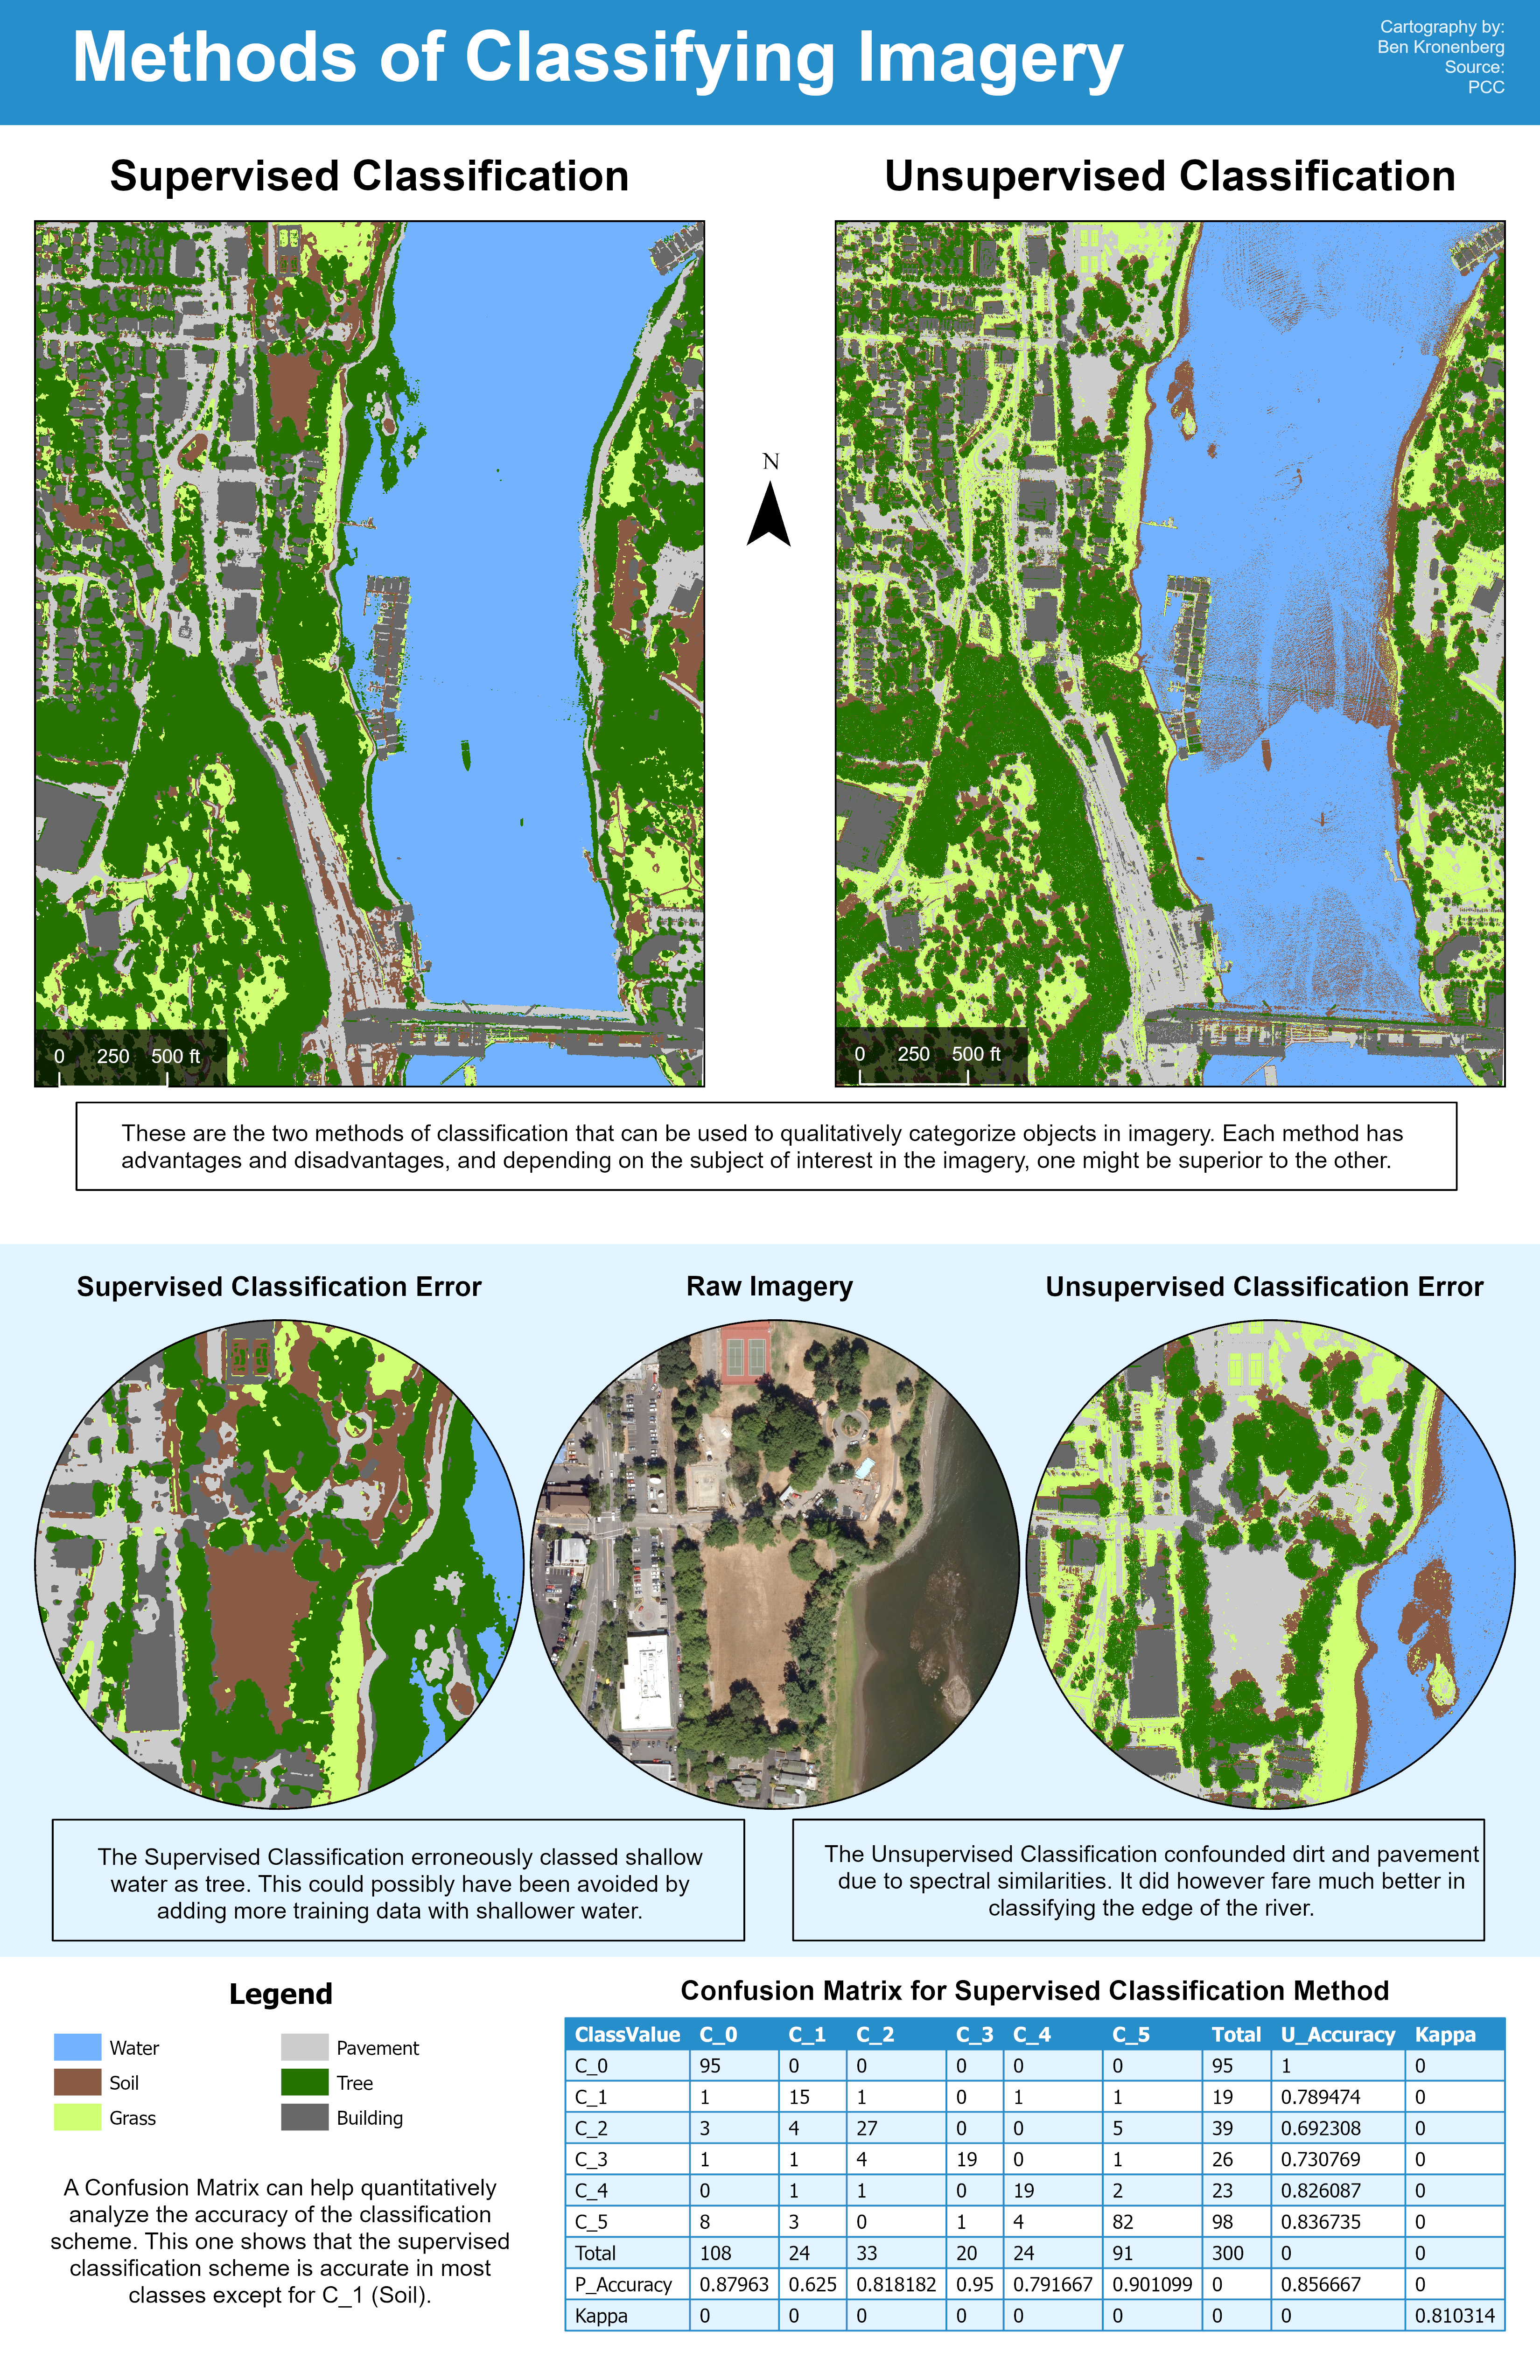
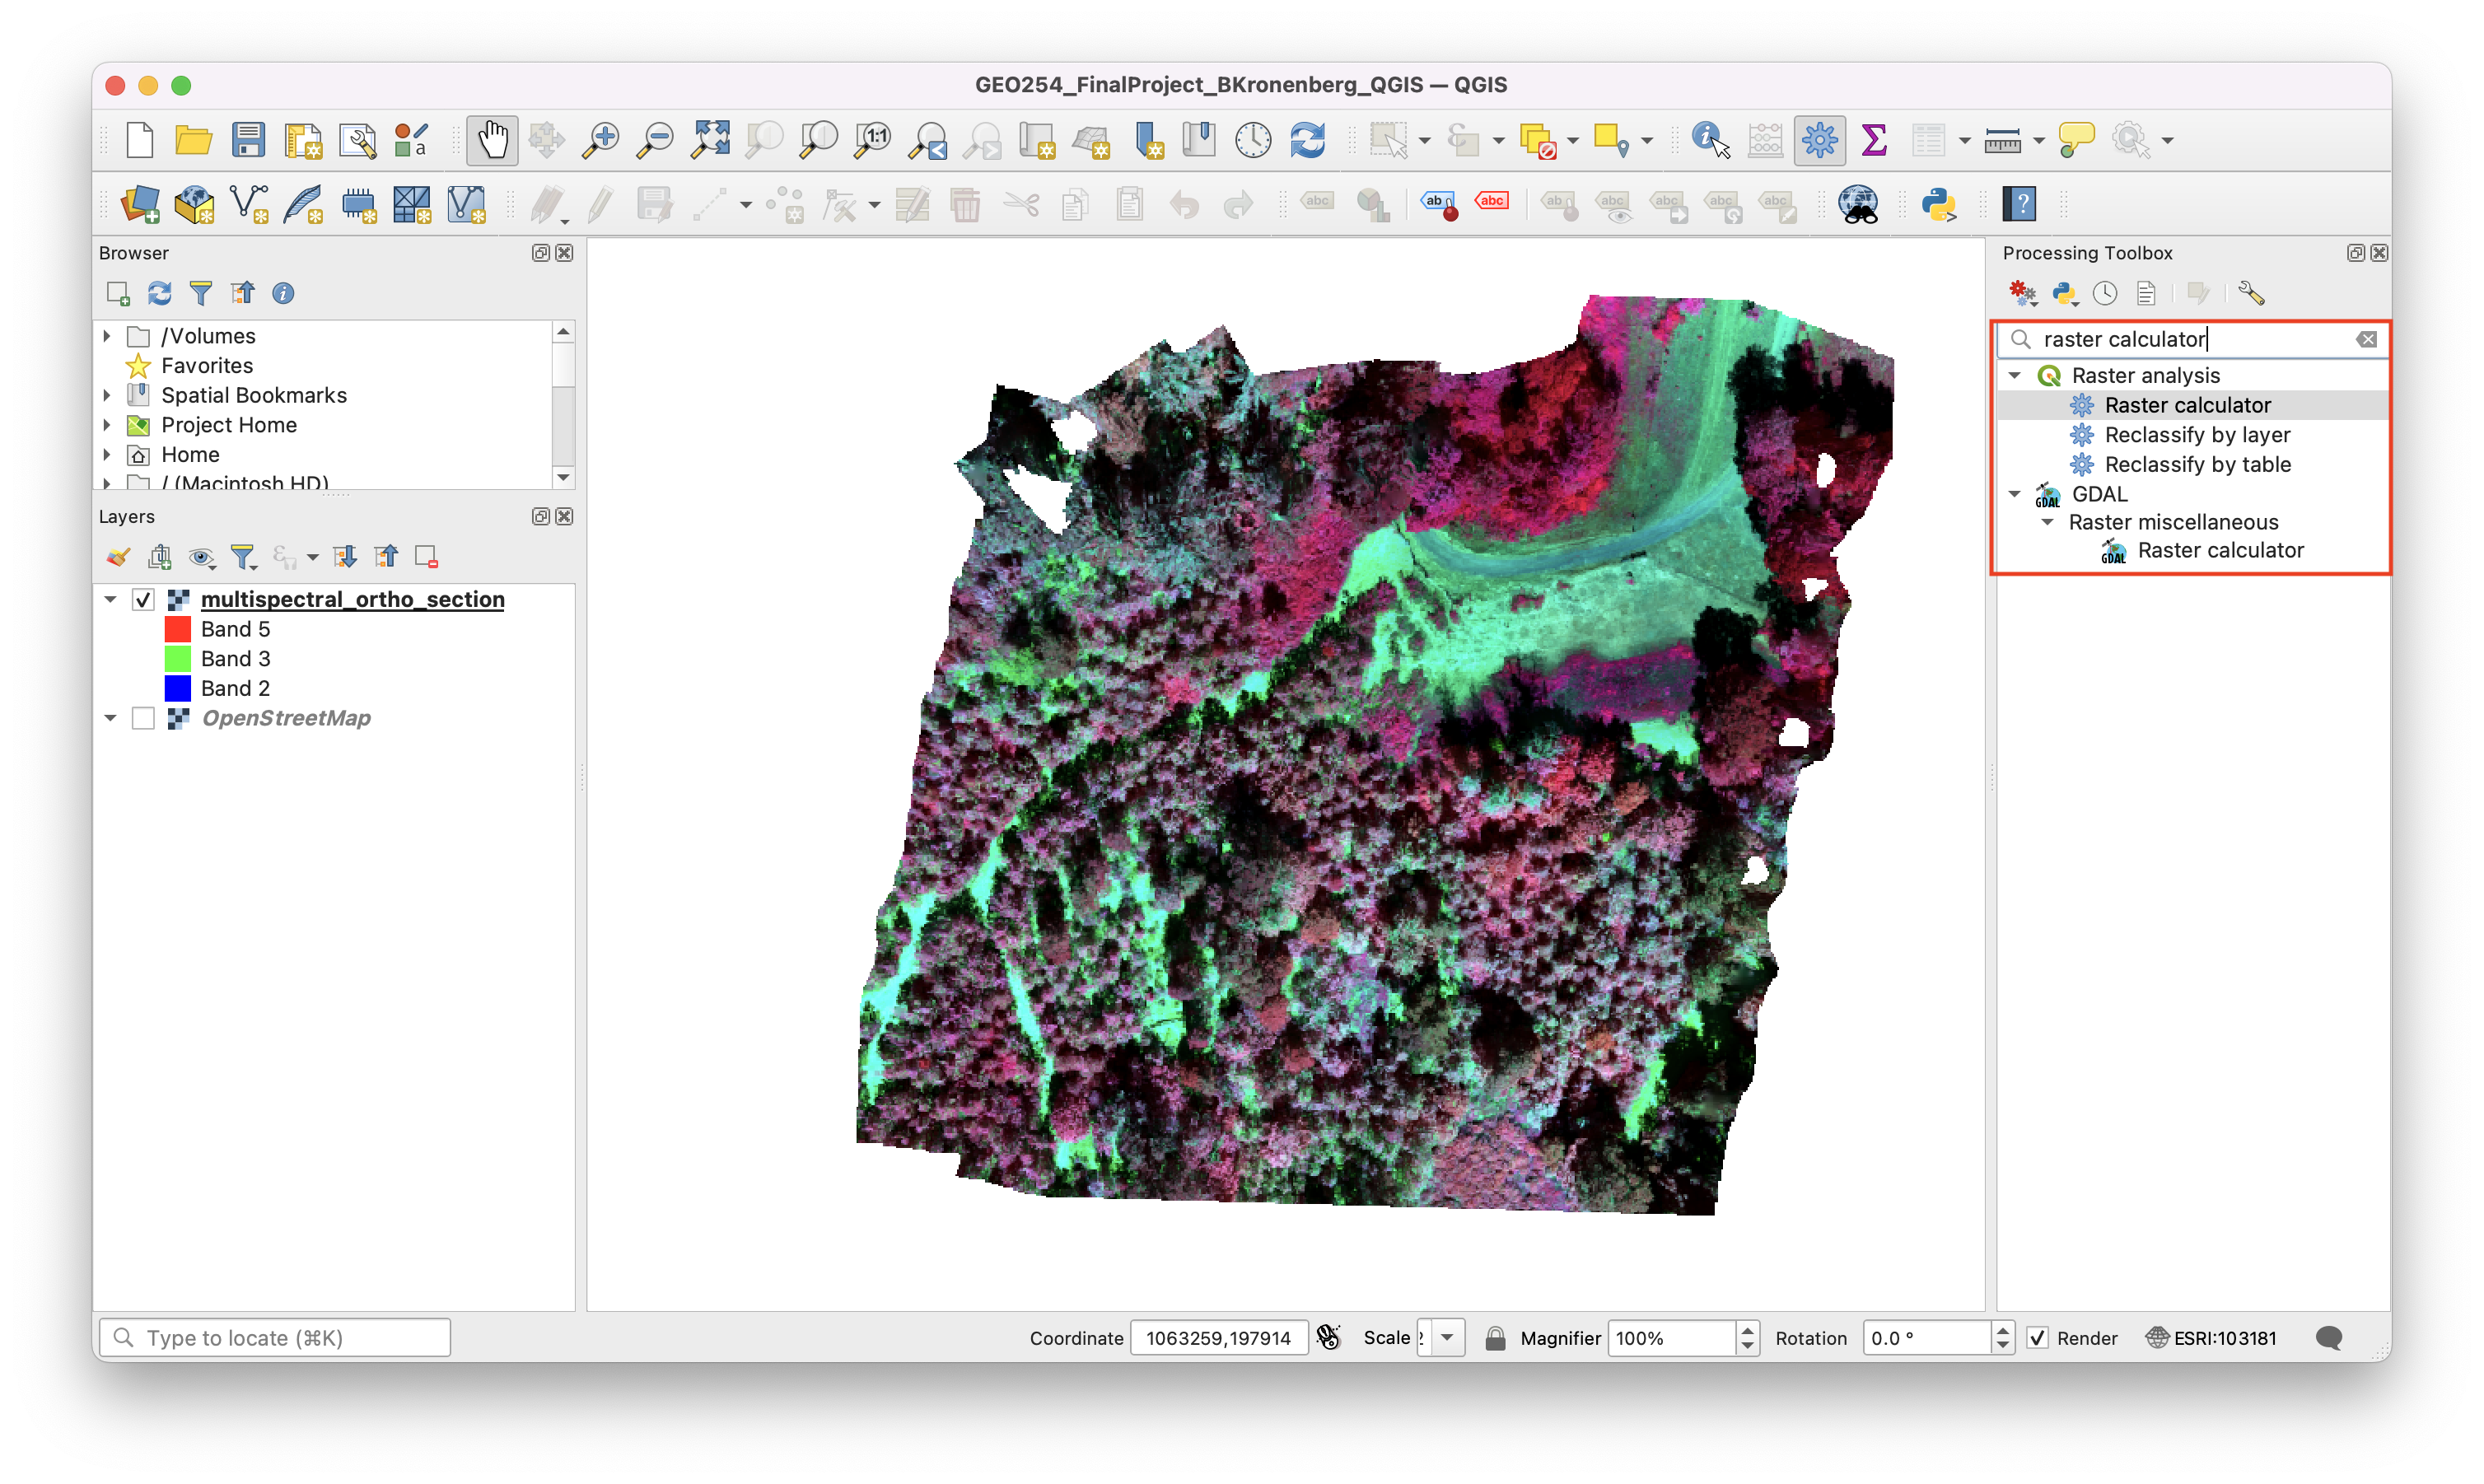
Supervised and Unsupervised Classification
In order to draw significance from and run computations on satellite imagery, image classification can be employed to categorize the content with distinct values. This school lab exhibited two methods of classification: Supervised and Unsupervised. Depending on one’s needs, different methods may be preferred. A Confusion Matrix shows the accuracy of the classification scheme using known values.

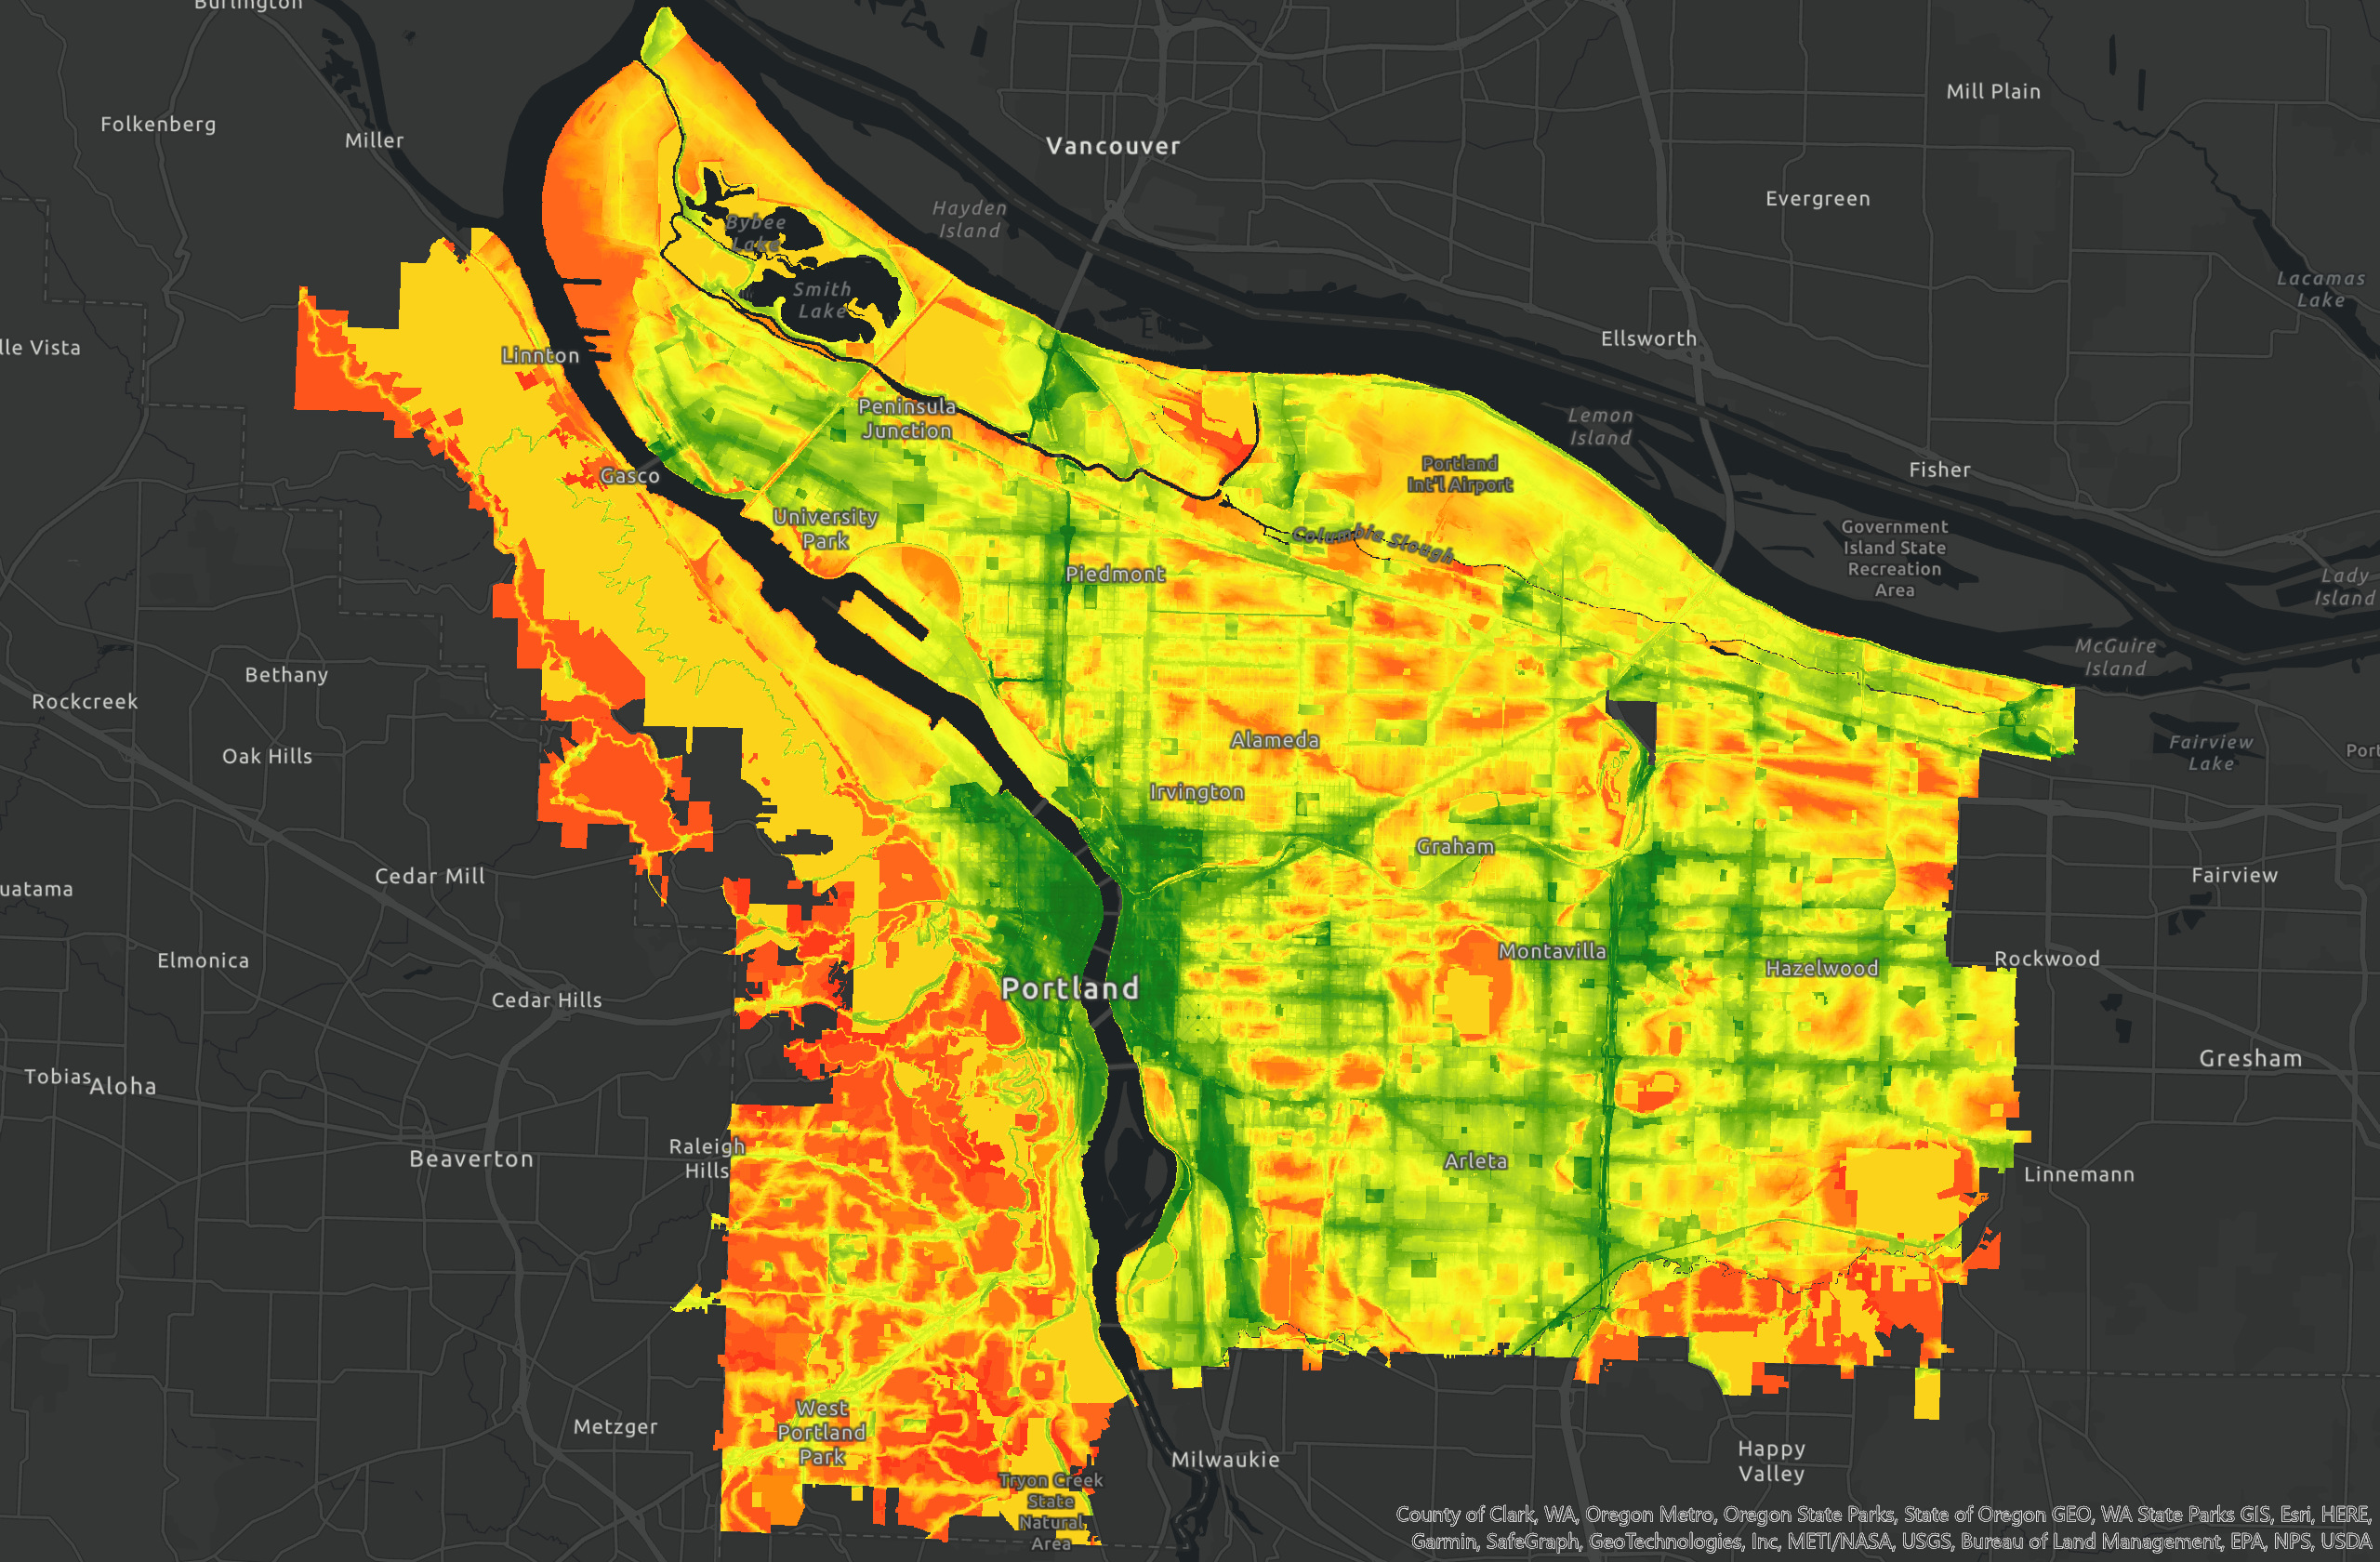
Heat and Land Cover
Using a change computation between two surface temperature datasets from 1992 and 2019, I compared urban growth with temperature change. The greatest increase in surface temperature occurs on the urban growth edges around various cities. The cities with the greatest development also experienced the greatest changes in surface temperature.
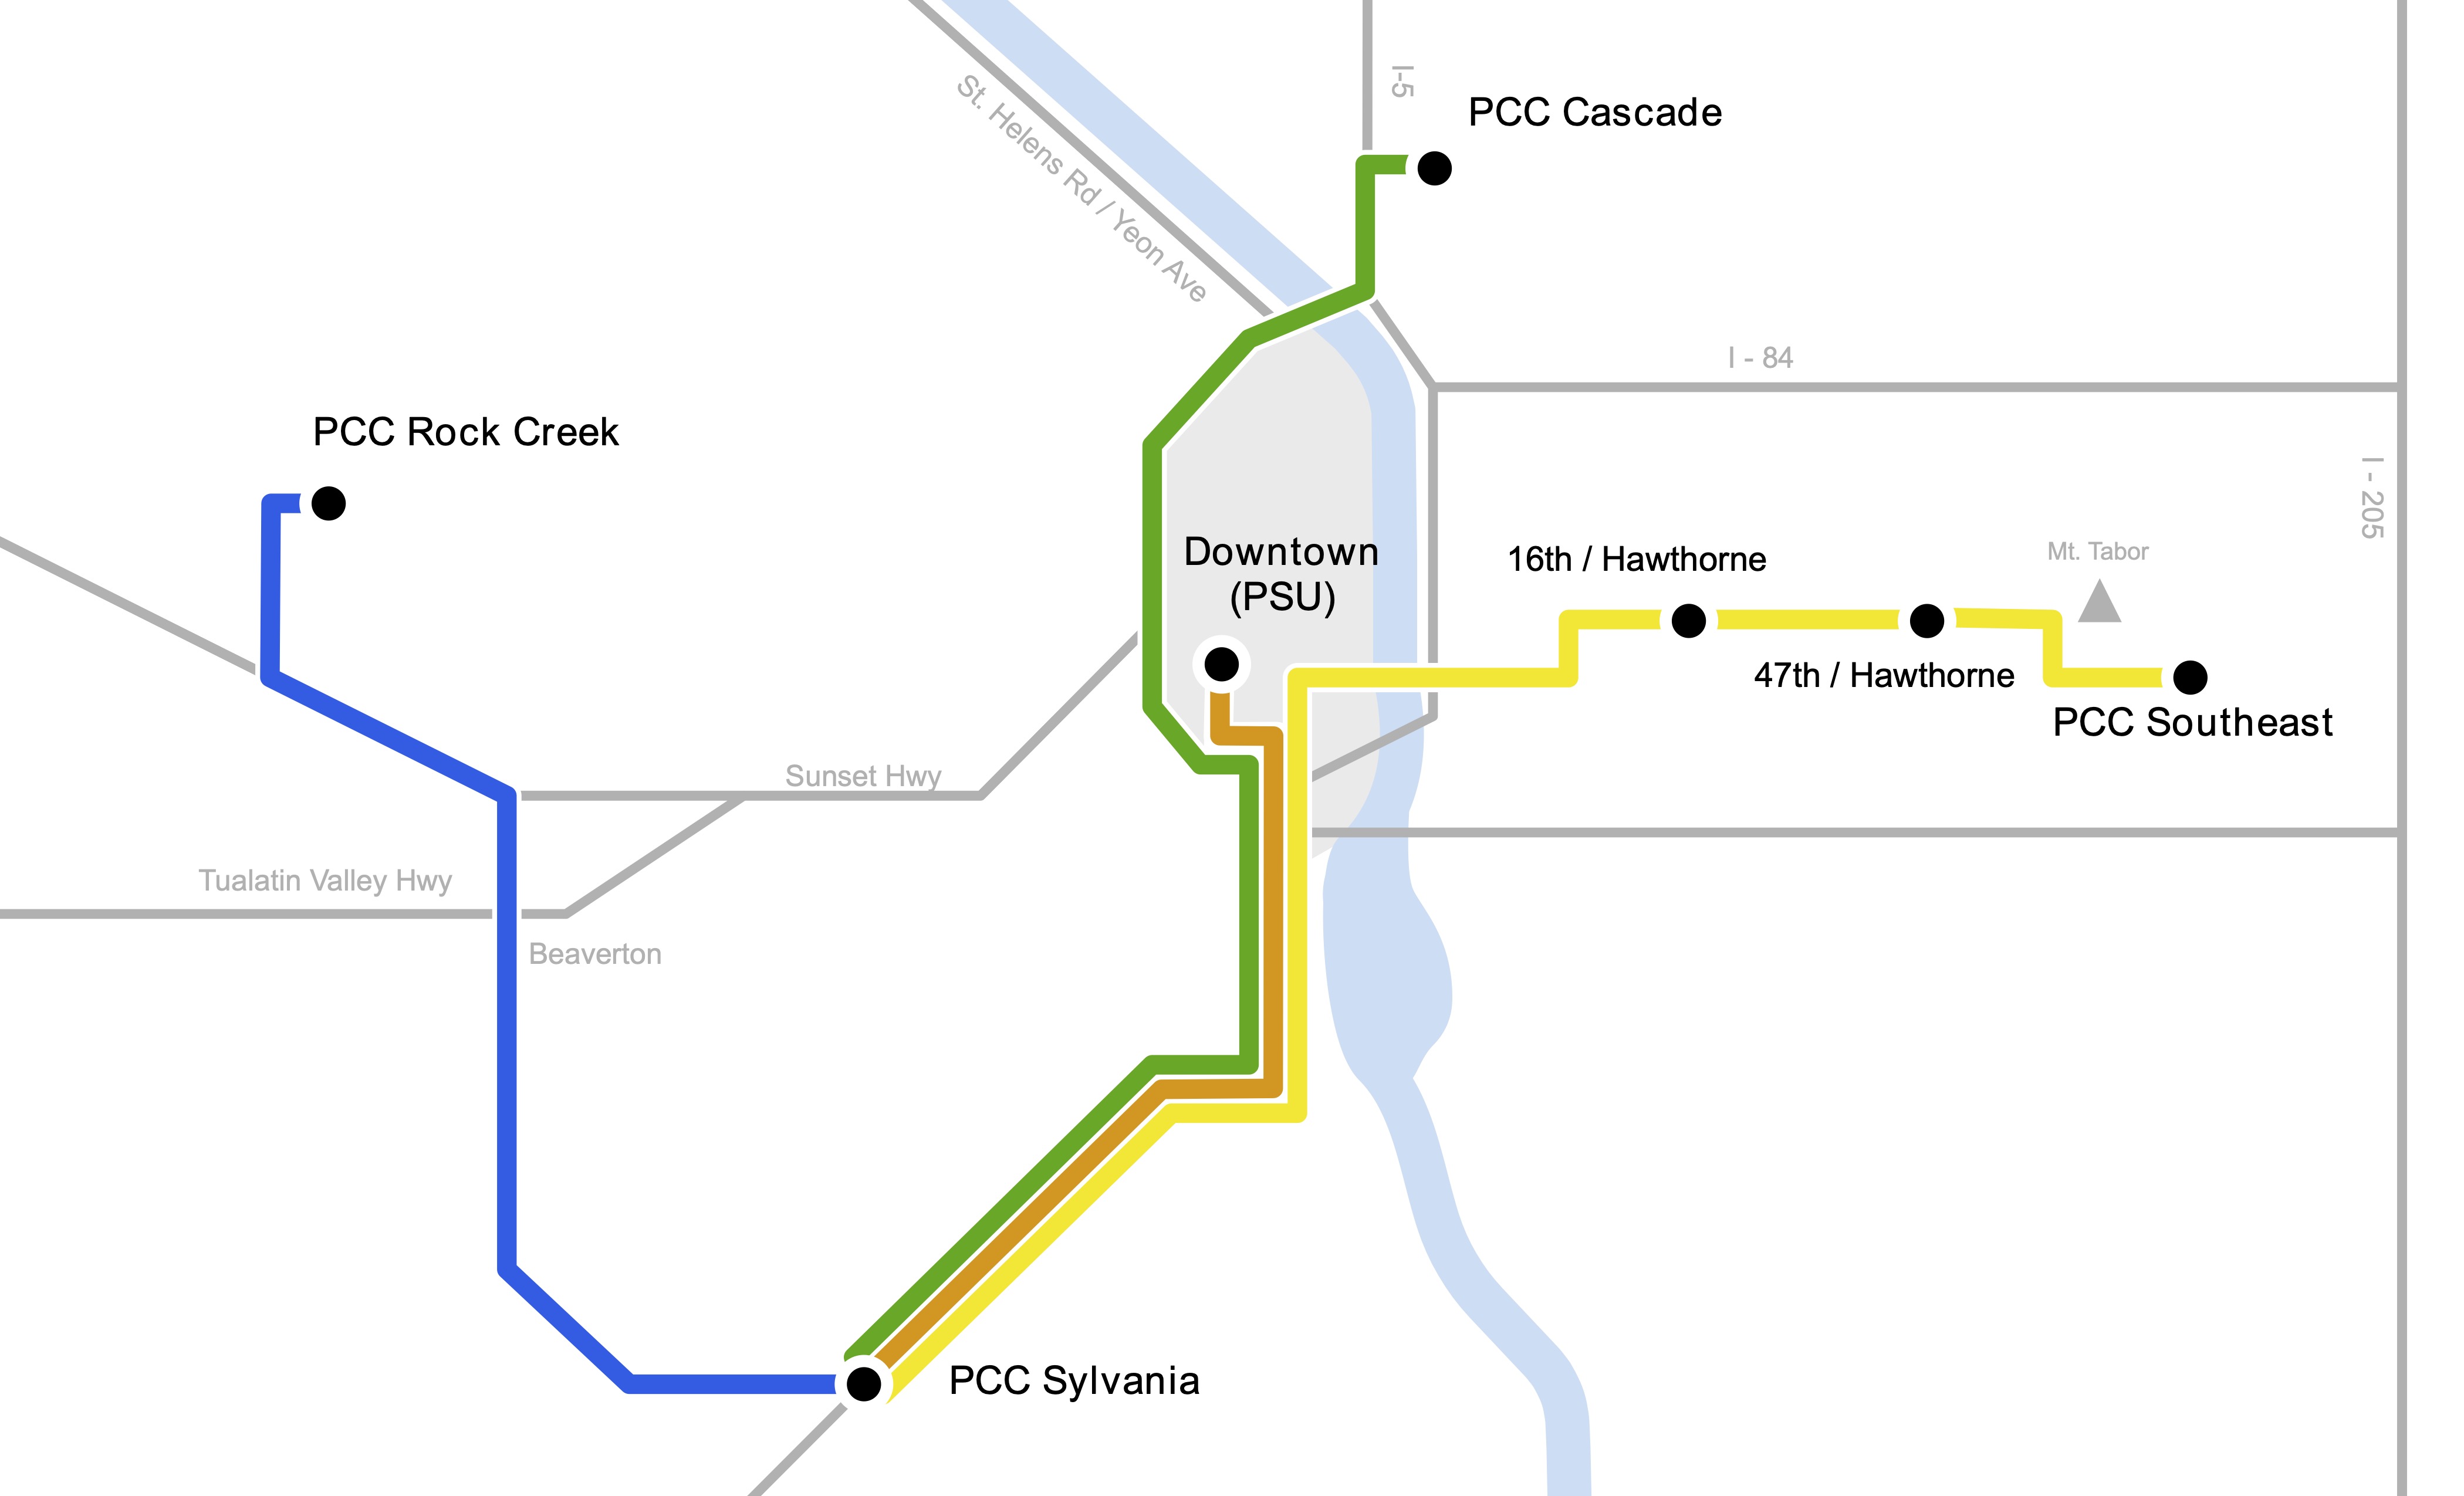
PCC Shuttle Transit Map
As part of an independent partnership with the Transportation department of Portland Community College, I developed a high quality, intuitive shuttle map for use in their printed media such as their brochures and posters. I currently am redesigning their brochure from scratch which will include this map on it. Focusing on simplicity, this map offers more spatial context to the shuttle system than the previous map, while keeping the information intuitive. Its vector-based design, small size, and CMYK color scheme makes it easily shareable and printable.